At PyOhio, I presented a slightly-revised version of my Capacity and Stability Patterns talk. I also gave a mostly-impromptu lighting talk on building a statistical profiler and reading flame graphs.
You can view my slides as a PDF here. Below, I’ll elaborate on each of them.
 Matt Robenolt and Craig Maloney had both referenced Python’s frame object heavily in their presentations on debugging. They inspired me to talk about another domain where the frame is prominent- profiling.
 Profiling is divided into two approaches:
- deterministic, which hooks into every function call. This gives you perfect information about what is runnign at every point in your programs execution how long it takes, but has serious overhead that makes it unsuitable for production and can itself skew results.
- statistical, which periodically samples the call stack to see what functions are running at that point in time. This lets you adjust the tradeoff between overhead and accuracy by adjusting the sampling rate.
I’ll show you how to write a barebones version of the latter.
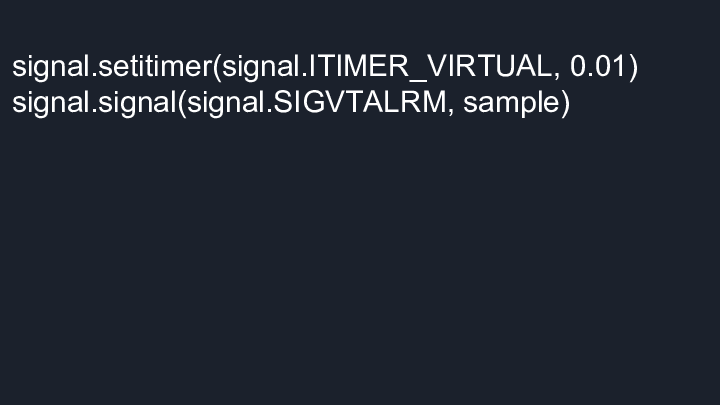 How can we get python to collect the samples? I prefer to make the operating system do the work. This code will cause it to send our program the ALARM signal in 10 milliseconds, and tells our program to run the
 sample function in response.
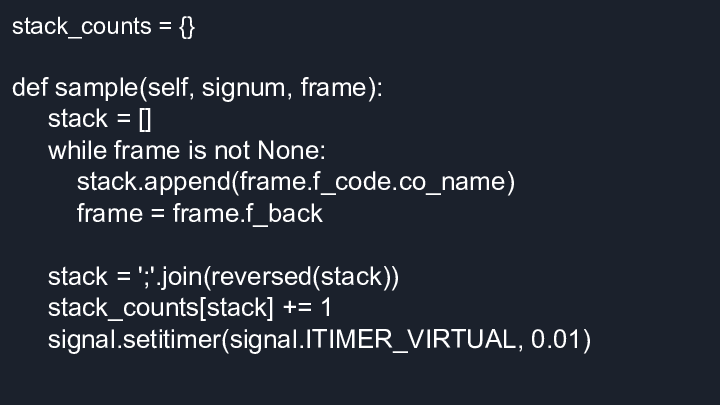 We’ll need somewhere to save the stacks we’ve seen, so lets create a dict for that(n.b. this should have been a defaultdict).
When python calls our signal handler, the last argument it passes is the frame of execution from when the signal was received. Let’s stick the name of the function that was running in a list, then work our way back down the stack repeating this process until we hit the bottom.
Now lets “fold” our list of function names in a way that’s useful later, stick it in our dict and increment the number of times we’ve seen it, then setup our timer so we sample again in another 10ms.
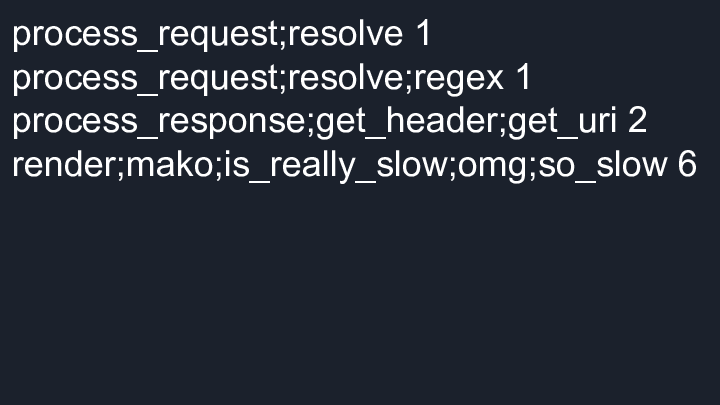 I’ll leave the code to print out the stacks as an exercise for you. At the end what we’ll have is this format. Each line is a unique stack that was seen. On the left is the name of the functions, seperated by semicolons, from bottom to top of the stack. On the right is the number of times this stack was seen.
Just from reading the text of my example, we can see that our imaginary program spent most of its time in mako.
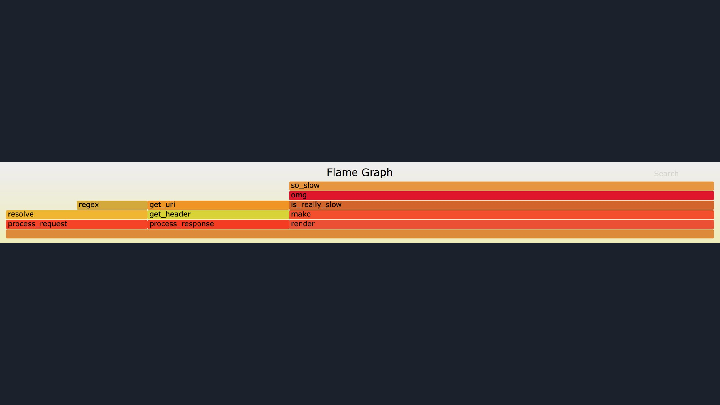 But why look at text when you can look at a graph! There are two key things to know about flame graphs: the colors are meaningless, and the X-axis doesn’t represent time. In a flame graph, the stacks are reordered to maximize the merging of frames. In this example, you can see how
 process_request was merged into one bar in the graph even though it was seen in two distinct stacks. The width of the bar tells us what percentage of the time this function was seen at this position in the stack when we sampled. In other words, loosely how much time we were spending in it.
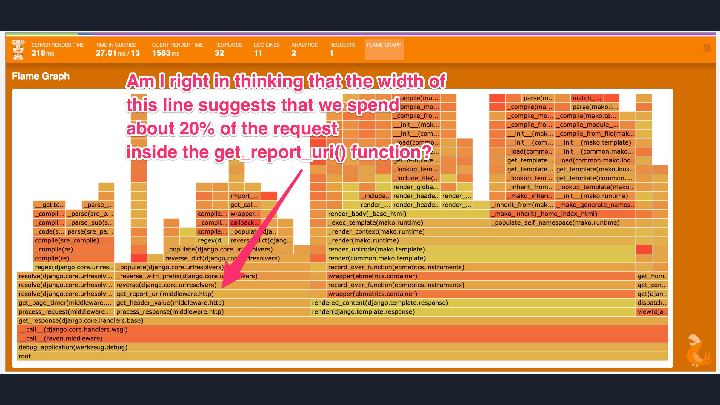 Is this useful? Yes! For a recent company hackathon I led a team that added a statistical profiler and flame graph visualization to an internal debugging toolbar. Even before we were finished, as we were sharing screenshots of our progress another developer looked at one and identified a low-hanging performance optimization for a popular page on our site.
 Check out these links for more on flame graphs and some profilers you should use instead of the code above. :-)