At DevOpsDays Atlanta 2018, I presented a lightning talk on reporting for ops team. I forgot to put that online until now!
Hi, I’m Brian. I work for Mozilla helping run the backend services that power parts of Firefox. I’m here to tell you why you should care about reports, why they’ve become so hard, and what you can do about it.

Like most of you here, my team depends on a lot of products to get our job done. AWS, pagerduty, datadog, etc. The result is a lot of information about how my team and our services are doing is locked up behind these products’ interfaces.

These products are fantastic, but their opaqueness is a problem. If we want to improve, we need visibility into this data, so we can ask questions about it and measure our progress.

Some products offer a reporting interface, but they’re often, well, garbage. They inherently silo the data, and they can’t be customized to answer the questions that are specific to your teams context.

The solution is to rescue your data from the clutches of these products. But how? I’ve found a few different strategies that can work depending on the specifics of what you’re after.

Some products will offer an export option or a public api. This is the ideal case. Exports can give you data without any fuss, but they may give more than you’re after. APIs require a little more work but can usually support better filtering.

Many products can be configured to send webhooks when events occur. Typically we think of them as a way to provide notification or trigger an action, but you can also store their payload to build a log.

If a product doesn’t seem to offer options, there are still ways. Many sites are rely on AJAX, so you can find and call the same unpublicized endpoints that their frontend uses. If all else fails, fall back to scraping and parsing HTML.

Next you need a strategy for storing the data. First, recognize that you don’t always need to. Sometimes your report is a one off, or the products API makes the data easy to fetch on demand. In that case just generate and publish.

Usually though you want to save the data in order to report on different time ranges and to support asking new questions down the road. Spreadsheets or relational databases are good options.
Hosted spreadhsheets like offered by Gsuite or office 365 have surprisingly power APIs for manipulating data in them, naturally excel at analyzing and displaying data, and their interface may be familiar to your reports audience.
Relational databases offer amazing query possibilities, and can be used to join datasets together. There are options like Amazon’s Athena or Google’s Bigquery that don’t require you to manage any infrastructure.
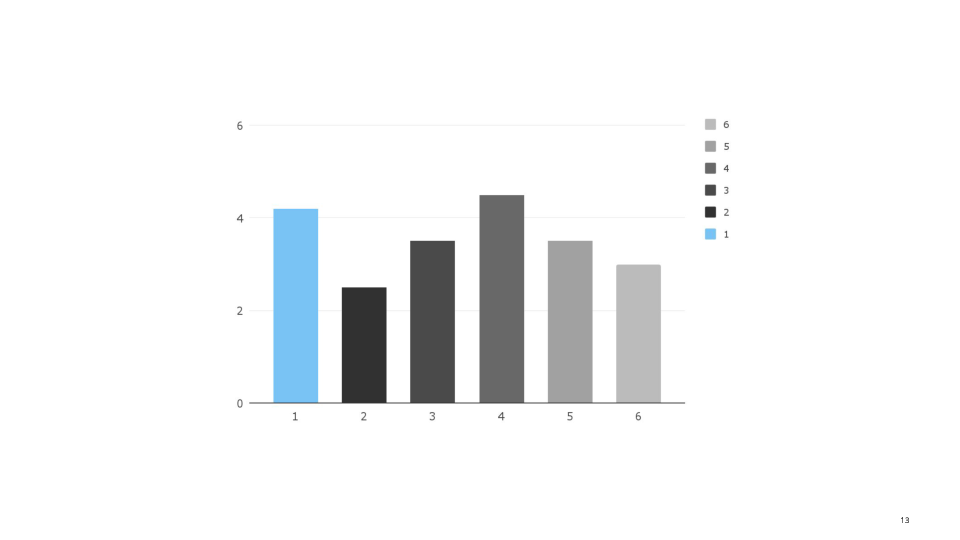
Of course, you’ll need somewhere to build and display your report. There are hosted products like Amazon’s Quicksight and Google’s Data Studio, open soure projects like Redash, or you can roll something custom with javascript charting frameworks.

Now for a specific example. When I joined Mozilla, my team didn’t have any visibility into the health of our on-call experience. The way we work is that each of us owns a small number of services and is permanently on call for them.

This focus is great, because we have lots of autonomy, deep knowledge of the services we run, and great relationships with their dev teams. But it has potential downsides, like workloads becoming unbalanced, or shared problems going unnoticed.

We wanted to know things like how often people we being paged, particularly outside their work hours. Which services are the noisiest? What types of incidents are the most frequent? Etc.

I wrote a script to pull the previous days incidents from pagerduty and extract and calculate the information we cared about. I tweaked our standard deployment pipeline to upload this script to AWS Lambda and run it daily.

I had the script store its output as JSON files in an S3 bucket, which I added as a table into AWS Athena. Finally, I added the table as a data source in Redash and built a couple dashboards to visualize answers to our most common questions.

Now we have the information we need to understand our on-call workload, rebalance assignments, prioritize improvements, and to track how such efforts play out over time.

I hope that I’ve given you some ideas for data your own teams might want to report on and how you can get access to it. If you want to talk about this topic further, find me in open spaces. Thanks!